

The following provides an overview of the projected climate for the Barwon South West Region. This exposure information has been modelled specifically for the purposes of this Project.
This analysis uses climate modelling of predicted future changes in temperature and precipitation, as well as published data on sea levels to identify areas of greatest exposure across the Barwon South West.
In addition, this study employs spatial climate mapping to more accurately determine the Region’s and each municipality’s relative exposure to projected future climate. This mapping uses a relative base line year and analyses projected changes in temperature and precipitation variables.
To understand the impact of rising sea levels and storm surges on properties, a series of publicly available maps (Future Coasts) have been developed which outline low lying areas potentially vulnerable to coastal flooding from rising sea levels. Combining the sea level rise assessment with the temperature and precipitation projections provides an overview of the combined effect (regional exposure) of all three primary climate variables.
Figure 13 shows a climate exposure map for the Region outlining the change in mean and extreme temperature and total and extreme precipitation projected for 2030 and 2070, as well as sea level rise in 2100. Each temperature and precipitation data set shows the incremental change in the climate variable compared to the base year of 1990.
This analysis uses climate-modelling software (SimCLIM developed by CLIMsystems) to model the projected changes in climate for 2030 and 2070. This modelling is designed to provide trends in climate variability at a local and regional level over time. This approach integrates 23 Global Climate Models with local historical Bureau of Meteorology (BoM) data into the overall modelling process. The climate modelling outputs are then verified against available State and National climate projections to ensure consistency in regional trends. A key feature of this downscaling is the ability to produce specific local climate projections (refer to Figure 11). It will also allow Municipalities to have access to user-friendly mapping where they can use the data with council owned assets to inform local decision making.
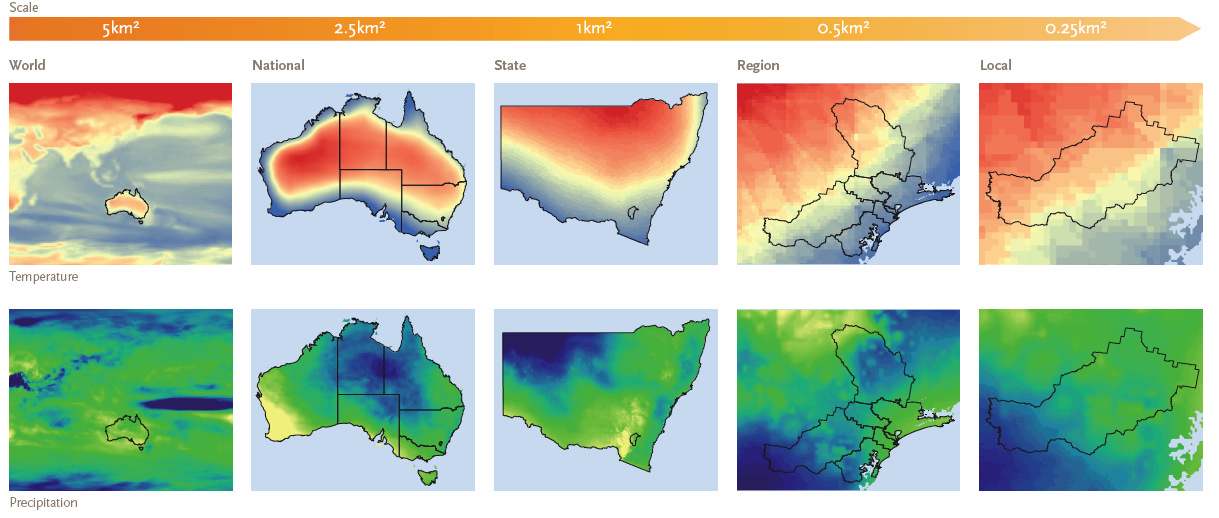
Figure 11: Climate modelling process (scale indicates level of downscaling)
This method allows the data to be extrapolated into a grid matrix that subsequently outputs the results into a size that can capture regional and local projections and allows for an even more detailed analysis. Appendix 2 provides a summary of the key climate modelling assumptions used.
By 2030:
- The future climate of the Region is expected to be hotter and drier, average annual temperatures will be around 0.6 °C (annual mean maximum temperature) warmer with winters slightly less than the other seasons
- The number of hot days (single days over 40 °C) is expected to increase by 8 per cent and 40 per cent for three consecutive days over 40 °C.
By 2070:
- Further increases in temperature are expected, occurring mostly in the summer with increases of 1.9 °C for annual mean maximum temperature
- The number of hot days will continue to increase. With single days of 40 °C expected to increase by 15 per cent and 67 per cent for three consecutive days over 40 °C.
Box 2 - Extreme heat analysis
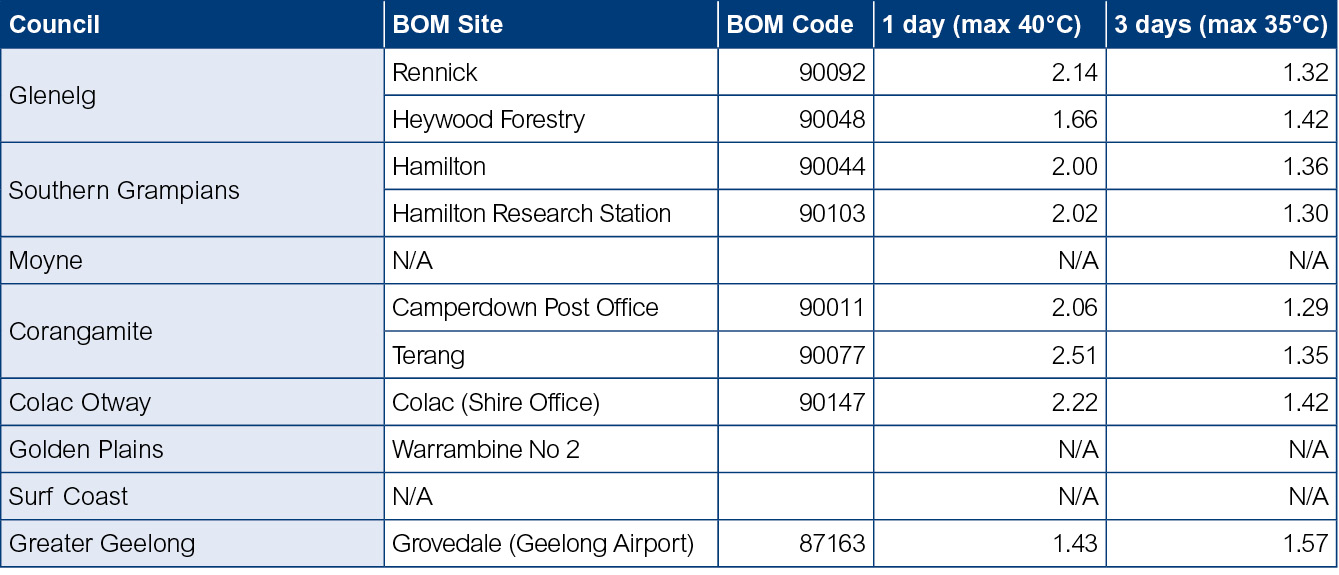
Further climate modelling for individual BoM sites across all ten municipalities of the Barwon South West for extreme heat events was undertaken and the results are shown in Table 4 below. This analysis concentrated on the summer season only using BoM data away from coastal zones and mountain ranges. This was undertaken to provide a more detailed understanding of the frequency of extreme heat events without the influence of annual average temperature and local features such as ranges and coastal areas that can potentially bias the data outputs.
However, according to modeling projections, there will not be an increase in the overall frequency of extreme heat events compared to the annual figures provided in Figure 13. Figure 13 indicates a single extreme heat day over 40oC will occur once every 1.12 years by 2030. The summer seasonal analysis instead indicates an event every 2.01 years by 2030. This decrease in frequency could be attributed to hotter days experienced in the months of October, November, March and April not captured in the seasonal snapshot.
For three consecutive days over 35oC the summer seasonal analysis indicated that such an event would occur every 1.39 years by 2030. In comparison the annual analysis for three consecutive days over 40oC indicated such an event every 2.51 years by 2030.
Table 4 Extreme heat analysis for the Barwon South West
By 2030:
- There will be reductions in the total average annual rainfall by 3 per cent (with greatest reductions occurring in Spring). However single 50 mm rainfall events will slightly increase by 3 per cent that could lead to localised flooding.
By 2070:
- Rainfall totals are likely to continue to drop by 7 per cent. However single 50 mm rainfall events will increase by up to 10 per cent that could lead to localised flooding.
By 2030:
- Increases in potential evaporation and reductions in relative humidity are expected to contribute to drier conditions
- Small increases in solar radiation are expected (by up to 0.8 per cent)
- There will be little change in average wind speeds.
By 2070:
- Conditions will become increasingly drier as evaporation continues to increase and relative humidity decreases
- Changes in wind speed will continue to be negligible.
Table 5 and Figure 13 provide a summary of the projected exposure for temperature, precipitation and sea level rise. Figure 14 provides further detailed mapping of the projected extent of coastal inundation along the length of the Great Ocean Road.
Dashboards should be read in context to this report and assumptions in Appendix 2. These dashboards provide a snapshot and show where the priority areas are as well as what areas may require further investigation or analysis.
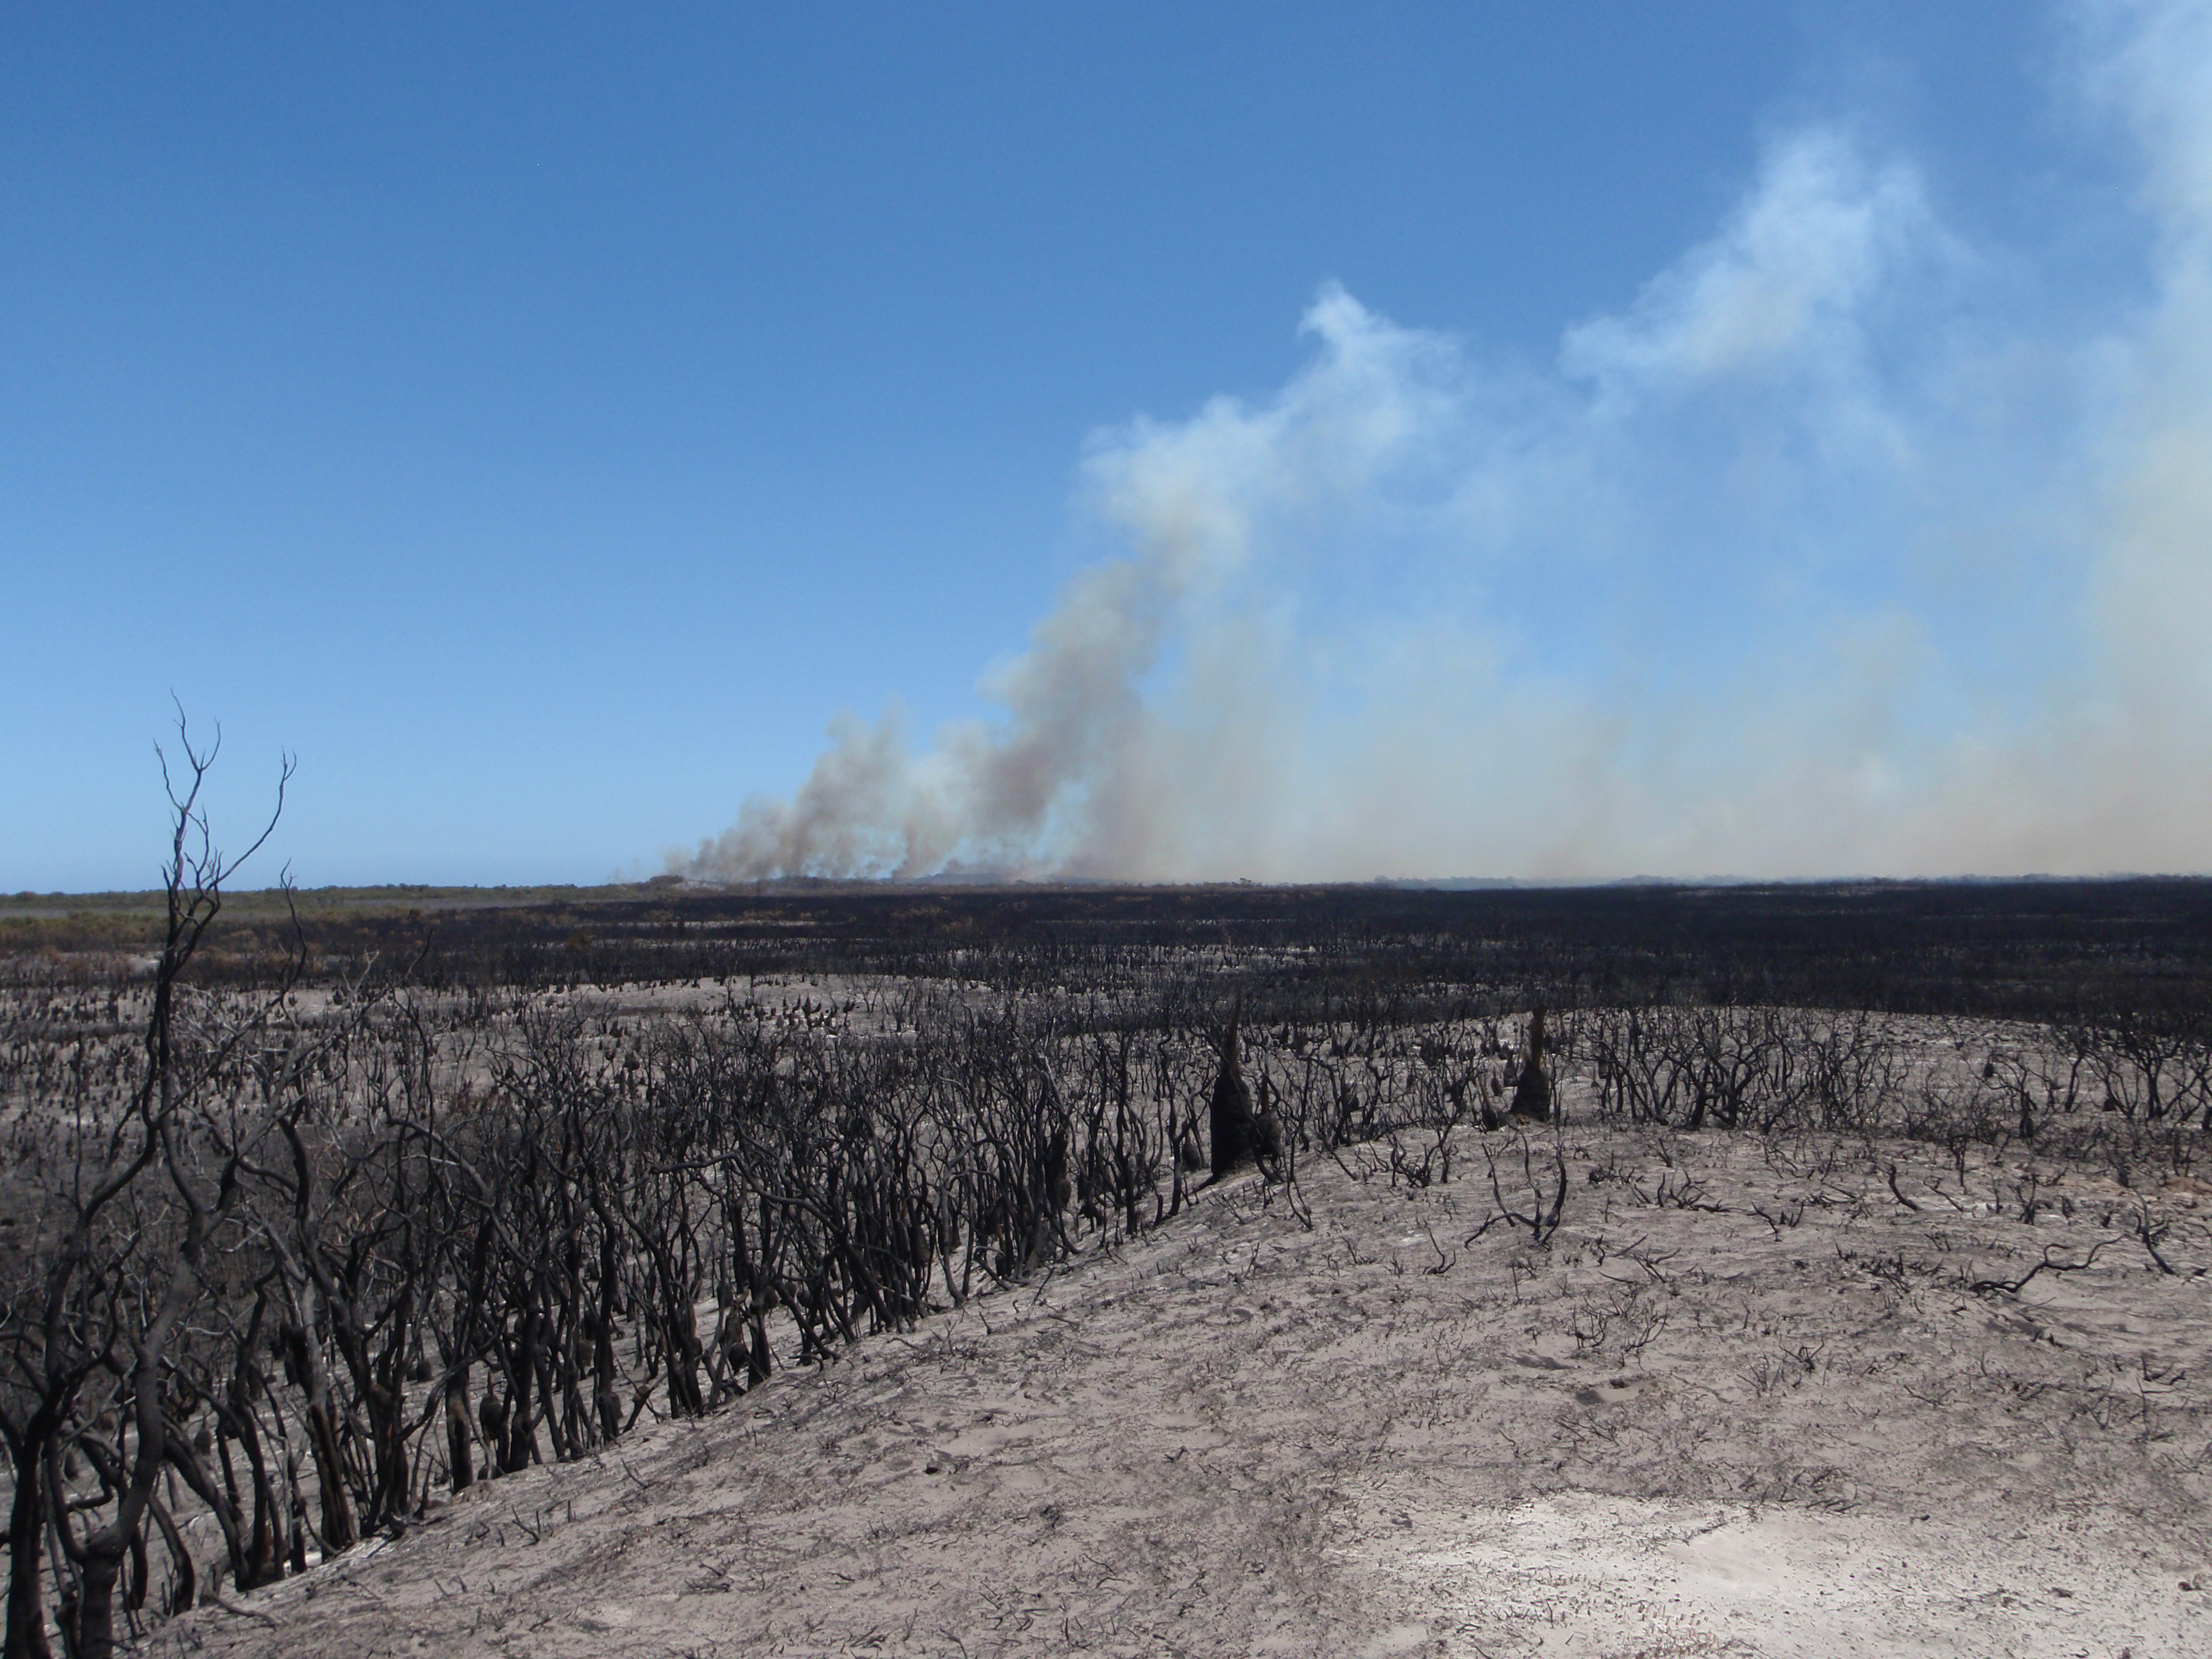
Figure 12: Kentbruck wildfire, 2013
| Temperature | Precipitation | Sea level rise |
|---|---|---|
|
Overall the Region is getter warmer, coupled with a significant increase in extreme heat events over 40oC (both single day events and three consecutive days). The warmest annual mean temperature in the Region will occur in the City of Greater Geelong. The coolest mean temperature in the Region will be in the Southern Grampians Shire. The greatest change in extreme temperature for single days over 40oC will occur in the Golden Plains Shire and the City of Greater Geelong for three consecutive days over 40oC. The least change in extreme heat events will occur in Glenelg Shire. |
Overall the Region is getting drier. Extreme rainfall events over 50mm will slightly increase over the entire Region due to geographical diversity. However, at a municipal level there is a decreasing trend. The driest area in the Region will be in the Borough of Queenscliffe. The wettest area in the Region will be in the Colac Otway Shire. The greatest change (decrease) in rainfall events over 50mm will occur in Moyne Shire Council. |
The Region has exposure to inundation along its entire coastline in particular the town centres of Apollo Bay, Port Campbell, Geelong, Portland, Port Fairy, Queenscliff, Torquay and Warrnambool. |
Table 5: Climate exposure summary for the Barwon South West
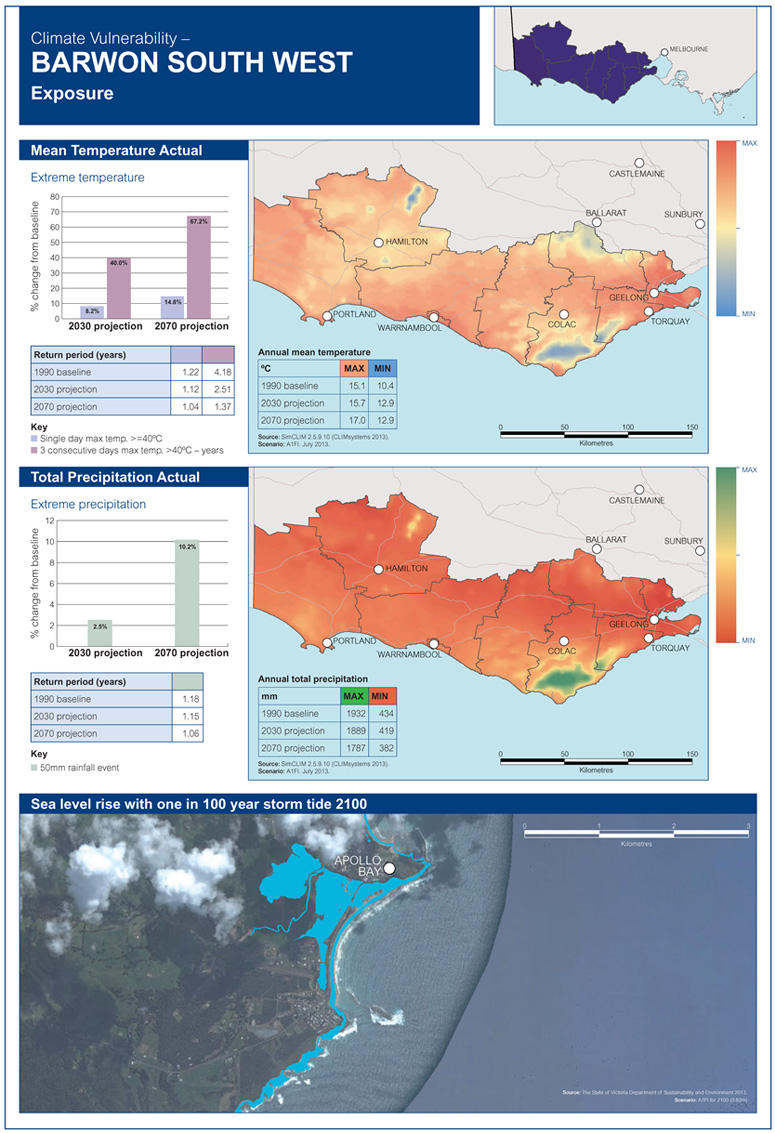
Figure 13: Climate exposure for the Barwon South West
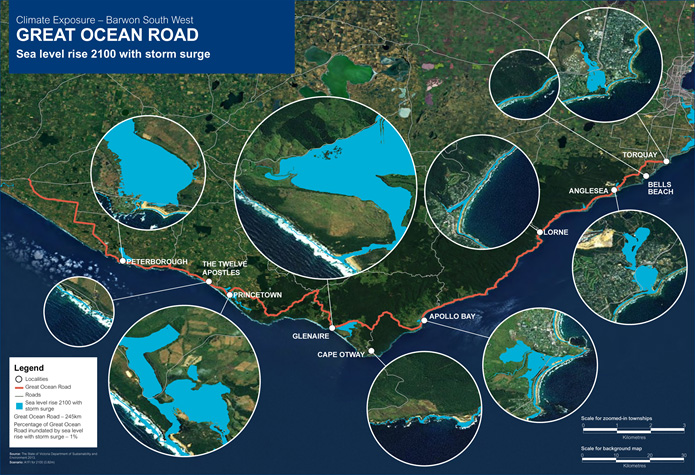
Figure 14: Coastal inundation along Great Ocean Road
Case study – coastal inundation along Great Ocean Road
Figure 14 outlines the extent of sea level rise with a one in 100 year storm tide by 2100 along the entire length of the Great Ocean Road. In total, approximately 1 per cent of the Great Ocean Road is directly exposed to such coastal inundation.
Figure 14 also provides a snapshot of the coastal villages such as Apollo Bay and tourist destinations such as Bells Beach with respect to this projected exposure.
A recent study commissioned by the Great Ocean Road Coast Committee (GORCC) on coastal climate change vulnerability and adaptation found that between Torquay and Lorne approximately $21.7 million of built infrastructure on GORCC managed land, such as boat ramps, car parks and caravan parks will be exposed to inundation with 0.8 metres of sea level rise, while $137 million of built infrastructure would be exposed to recession. The study also indicates that projected coastal inundation may affect the operation of key reef-based surf breaks including Bells Beach.
Victoria
Climate sensitivity and adaptive capacity
