

Incidence of drought, heat waves, sea level rise, storm surge and extreme rainfall are all expected to vary in their incidence, intensity and location as the climate changes.
Whilst there are challenges in downscaling the likelihood of these events from global climate models to the district level, it is possible to locate and predict the likely occurrences of these events under future climate change scenarios.
Vulnerability to climate change is a difficult combination of exposure, sensitivity and adaptive capacity to climate events that are moderated by local adaptive capacity. So whilst the degree of exposure to climate stressors can be readily modeled and mapped, indicators for sensitivity and adaptability require considered choices. Selection is especially difficult when the interpretation of vulnerability is wide, covers a broad spectrum of triple bottom line issues, and must be framed around risk, as is the case for the Barwon South West Region. Currently there is no agreed national protocol or common practice for the selection of vulnerability indicators. In practice, wide ranges of indicators have been selected to assess climate vulnerability from the general (e.g. social well being) to the specific (e.g. flood prone areas).
The climate vulnerability assessment has chosen indicators based on their primary use. Given that the nature of climate events determines the degree of vulnerability and how to measure it, there are four main categories of use:
- Locate vulnerability
- Predict the timing and/or intensity of vulnerability
- Monitor change in vulnerability over time
- Support prioritisation of risk and/or mitigation actions.
These distinctions reflect the fact that no one metric can easily cover the full range of assets and values or provide clear priorities for adaptation.
The map for social, economic and environment (Figure 16) indicates where areas will have the highest sensitivity and least adaptive capacity to the projected changes in climate across the Region.
In summary:
- The social map indicates human populations, which have high sensitivity and low adaptive capacity to projected changes in climate
- The economic map indicates land use activities, which have high sensitivity and low adaptive capacity to projected changes in climate
- The environment map indicates natural systems and conditions, which have high sensitivity and low adaptive capacity to projected changes in climate.
The key indicators that were selected to measure the sensitivity and adaptive capacity within the Barwon South West Region are outlined below in Table 6.
These indicators have been ranked based on current sensitivity and adaptive capacity to provide an overview of what the regional trends are.
These indicators are based on existing data sets that outline the current state, demographics, capability and conditions and do not include projected changes in these parameters. When combined with the climate exposure layers it provides an indication of overall vulnerability for the Region and each municipality.
These maps do not reflect actual data boundaries as these maps have all been consolidated into Census data boundaries. This has been done to provide consistency across the three maps, provide regional trends and for ease of interpretation.
| Scope | Key climate impacts for Region | Indicators |
|---|---|---|
| Economic | ||
| Built environment
Financial and physical capital |
Agriculture sector put under stress, in particular:
|
Areas of economic activity for agriculture land use (Source: Victorian State Government) Soil productivity and degradation (Source: Australian Government, Department of Agriculture) |
| Water infrastructure put under stress
Decrease in water yield
Increase in water demand |
Water supply-demand balance (Source: Wannon Water and Barwon Water) | |
| Power infrastructure put under stress
Increase in electricity demand from winter heating to summer cooling |
Energy supply demand (Source: Powercor) | |
| Environment | ||
| Natural environment | Reduction in water quality and flows in rivers and wetlands | Wetland extent and condition (Source: Victorian State Government)
Groundwater salinity (Source: University of Ballarat) |
| Altered species distribution | Native vegetation extent and condition (Source: Victorian State Government) | |
| Greater bushfire activity | Bushfire prone areas (Source: Victorian State Government) | |
| Inundation from heavy rains and storm events | 1 in 100 year flood prone areas (Source: Victorian State Government) | |
| Social | ||
| Human capital | Increase in heat-related health problems, in particular:
|
Age (above 65 and living alone and full dependant – four years and under)
Household ownership
Median house income
Non-English speaking backgrounds
Population density (Source: Australian Bureau of Statistics) |
Table 6: Sensitivity and adaptive capacity indicators for the Project
Table 7 and Figure 16 provide a summary of the social, economic and environmental sensitivities and adaptive capacity for the Region.
| Social | Economic | Environmental |
|---|---|---|
|
|
|
Table 7: Key findings for climate sensitivity and adaptive capacity across the Region
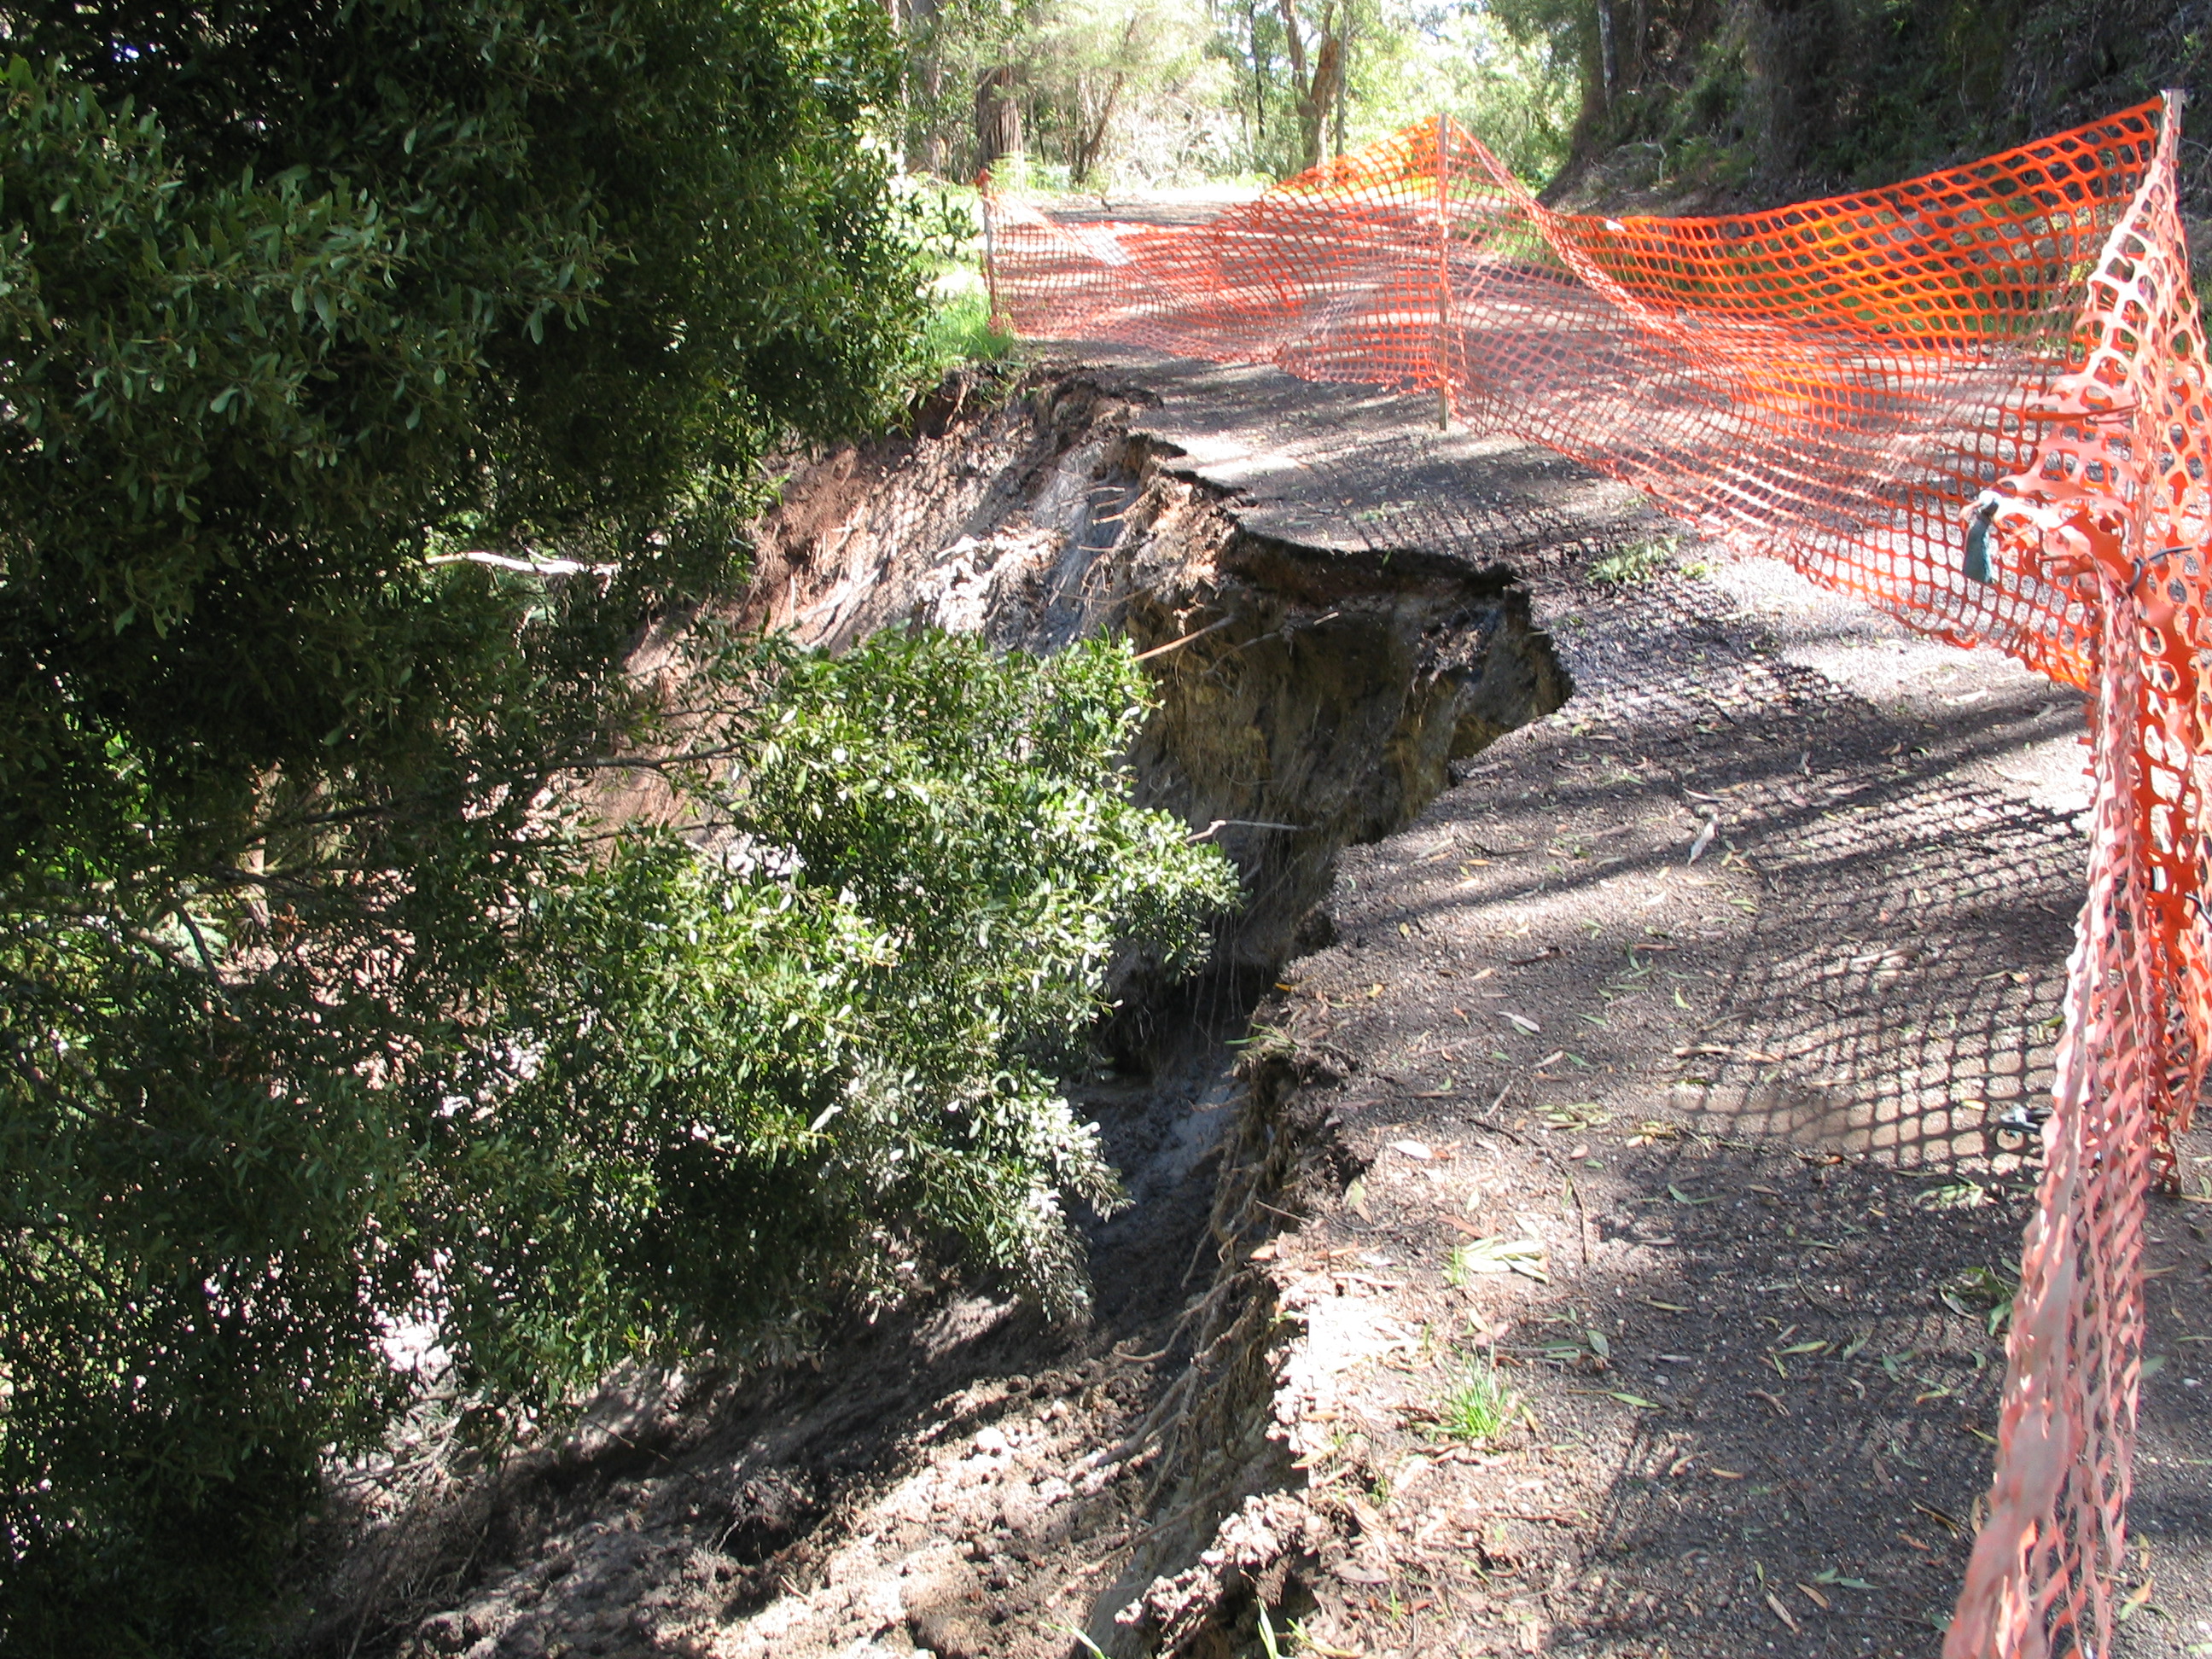
Figure 15: Landslip triggered by heavy rain along Devondale Road, 2008
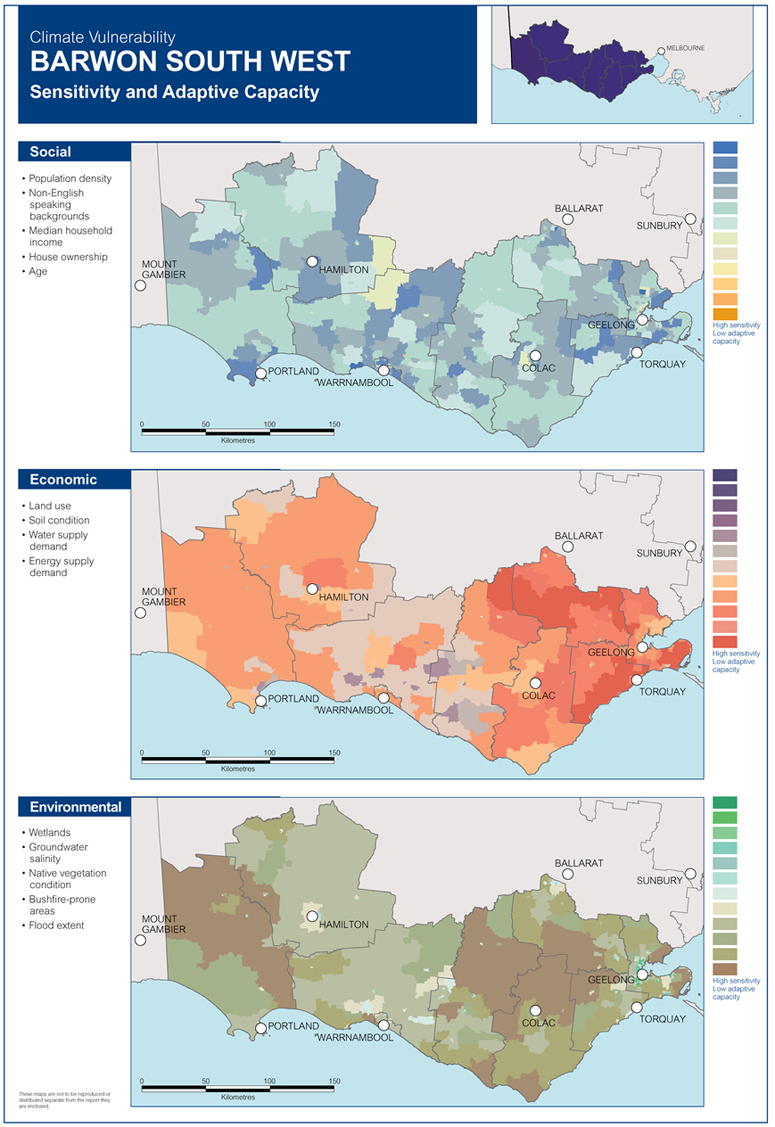
Figure 16: Climate sensitivity and adaptive capacity for the Barwon South West
Barwon South West
Overall vulnerability
